

About us
About Infodengue
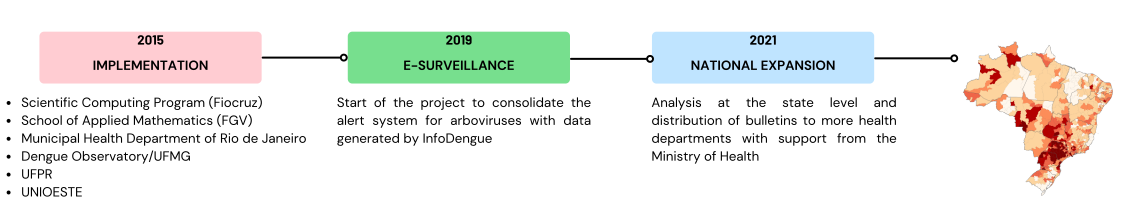
Infodengue is an early-warning system for arbovirus transmission (dengue, chikungunya, and zika) operating in all Brazilian municipalities. Launched in 2015, the system is maintained by researchers from the Scientific Computing Program (Oswaldo Cruz Foundation, RJ) and the School of Applied Mathematics (Getulio Vargas Foundation), in partnership with and supported by the Ministry of Health.
An early-warning system aims to anticipate changes in arbovirus reporting patterns so that surveillance professionals are informed as early as possible about potential shifts in outbreak and epidemic risk. Since its inception, Infodengue bulletins have supported municipalities and states in guiding actions and issuing alerts. In 2021, with support from the Ministry of Health, the system reached national coverage. State-level reports can be requested by state health departments.
History of Infodengue
Our collaborator network includes national and international research groups seeking solutions for arbovirus surveillance and response, as well as civil-society organizations. By sharing experiences and methodologies, we expand our capacity to innovate in arbovirus surveillance.
All code used to generate Infodengue analyses is available at: https://github.com/AlertaDengue .
The many technical and scientific challenges faced during Infodengue’s development have led to theses and dissertations. As challenges persist, we continue—and will always continue—to investigate new solutions that produce useful information for management and for advancing knowledge on arboviruses and their control.
About the system
The figure below presents the Infodengue workflow. Each step is detailed next.
Infodengue workflow
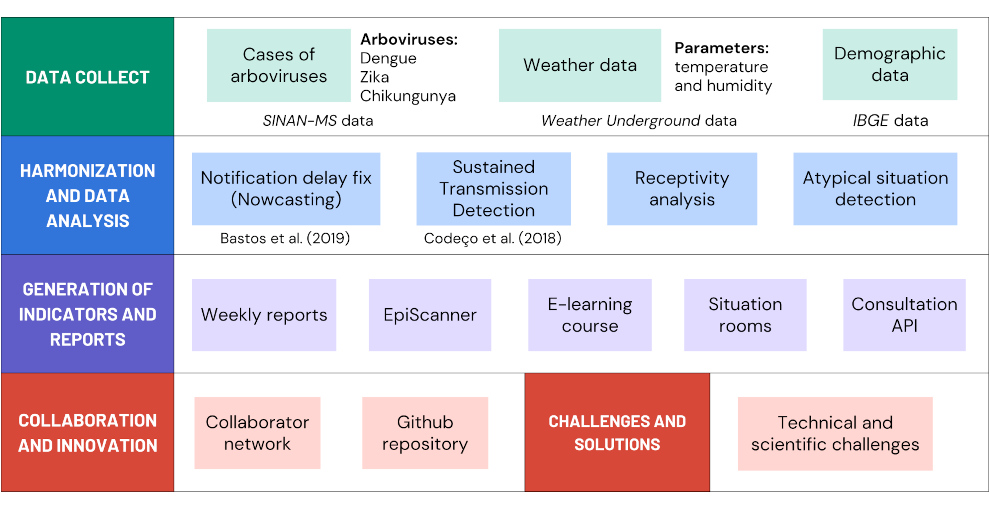
1. Bastos, Leonardo S., et al. “A modelling approach for correcting reporting delays in disease surveillance data.” Statistics in Medicine 38.22 (2019): 4363–4377. 2. Codeço, Claudia T., Daniel A. M. Villela, e Flavio C. Coelho. “Estimating the effective reproduction number of dengue considerando temperature-dependent generation intervals.” Epidemics 25 (2018): 101–111.
Data collection
Notified cases of dengue, Zika, or chikungunya. These are notifiable diseases: the health professional who diagnoses a suspected case must complete a notification form that feeds SINAN (the National System for Notifiable Diseases). Only a fraction of cases are laboratory-confirmed; most receive final classification based on clinical and epidemiological criteria. The incidence indicators used by Infodengue are calculated using all notified cases. Notification data are obtained from the Ministry of Health.
Meteorological data. Arbovirus transmission is strongly influenced by climate. The vector mosquito, Aedes aegypti, requires high temperature and humidity to reproduce and survive. The virus infecting the mosquito also replicates better at higher temperatures. Temperature and humidity data are obtained from the project’s API Mosqlimate, which aggregates satellite reanalysis data provided by Copernicus ERA5. In the past, these data were sourced from airport weather stations.
Demographic data. Epidemiological indicators require population size. The demographic data of Brazilian municipalities are updated annually in Infodengue using estimates from IBGE.
Data harmonization and analysis
Correction for reporting delay
Available disease-occurrence data may be delayed for many reasons, including the time between falling ill and seeking care, the time a health professional takes to report, and the time required to aggregate information in databases. Such delays hinder decision-making because one must look at out-of-date data.
To address this, the Infodengue team developed a statistical method based on Bayesian inference that combines delay estimation with the historical temporal pattern of incidence to compute the expected number of cases each week. This short-term forecasting process is described by Bastos, Economou et al. (2019).
The figure below (from Bastos et al., 2019) illustrates the importance of this correction. The black curve shows the actual incidence, while the red curve shows the information available at the decision time. Note that the available data suggest a decline when, in fact, incidence is rising. The correction model (grey) shows the adjusted incidence. For technical details, see the publication. These functions are available in the R AlertTools package.

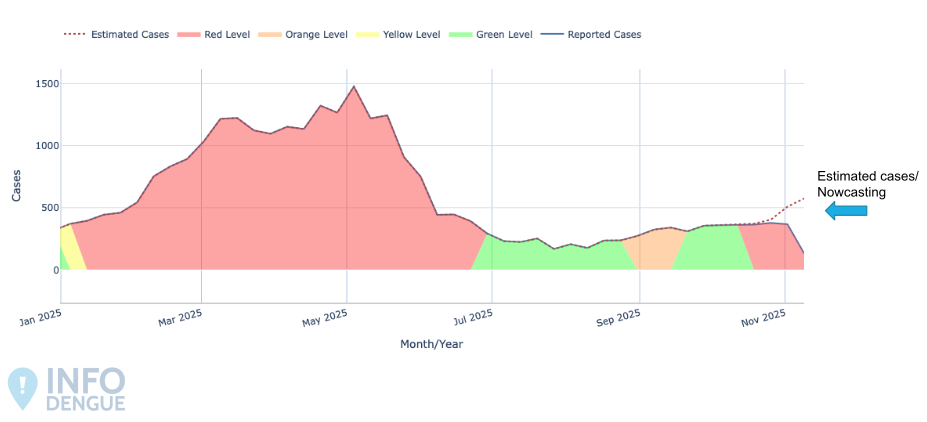
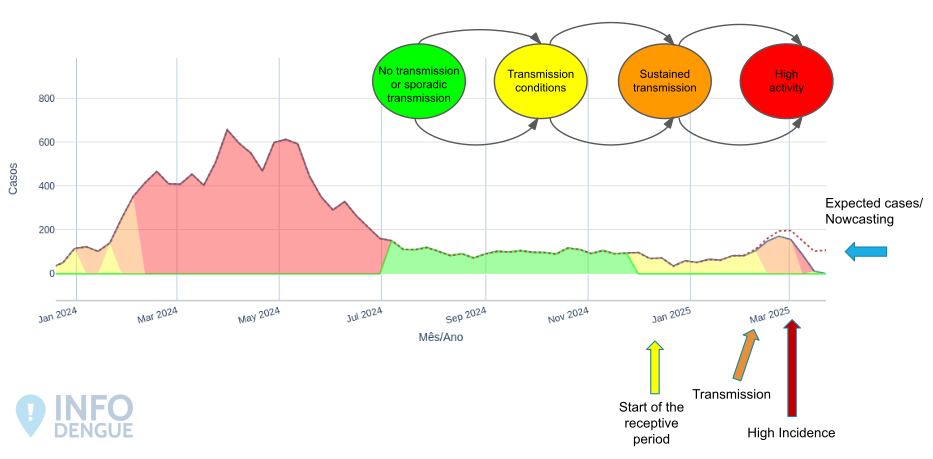
In the figure below, an example shows how cases estimated by the nowcasting methodology appear in municipal-level charts, which can be accessed by searching for a municipality in the “Find a municipality” field in the navigation bar. The dark-red dotted line represents the nowcast, and the blue line indicates cases notified to date. Colours in the shaded area represent the alert levels described next.
Correction for reporting delay
Receptivity analysis
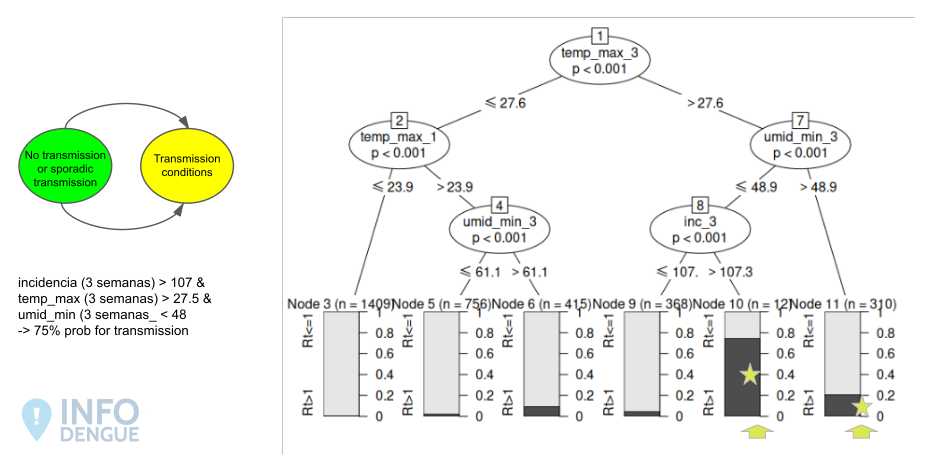
Arbovirus transmission requires suitable climatic conditions, which can vary by location. In Rio de Janeiro, for example, temperature above 22 °C is a necessary condition for sustained transmission. In Fortaleza, maximum humidity above 85% is required. We fit decision-tree models to evaluate which combinations of climatic and environmental variables indicate transmission conditions.
The figure below shows an example for one city. The tree depicts conditions most associated with weeks of transmission (Rt>1). When a week occurs with maximum temperature > 27.6, there is a high probability of transmission three weeks later (darker bars). This happens when incidence was already high (>107.3) or when humidity was high (>48.9). These rules are used to move from green to yellow level. Each municipality has its own specific set of rules.
Receptivity for transmission
Detection of sustained transmission
Estimating the reproduction number is important in several ways. A sequence of weeks with critical transmission (Rt > 1) indicates sustained transmission—that is, the propagation phase of the disease—requiring appropriate control actions. Conversely, subcritical periods (Rt < 1) indicate there is no sustained transmission.
To estimate Rt from incidence data, we developed our own methodology, described in Codeço et al. (2018). “Estimating the effective reproduction number of dengue considering temperature-dependent generation intervals.”
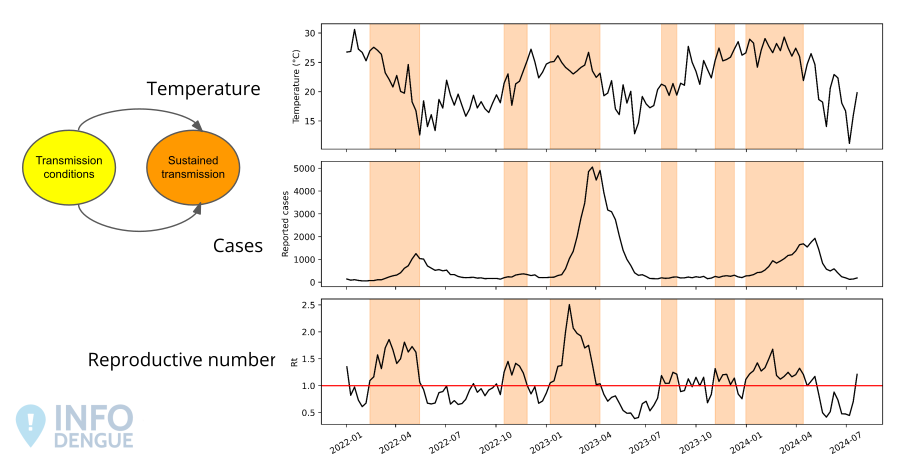
The figure below has three panels: the first shows mean temperature; the second, notified cases; and the third, Rt estimated from the combination of cases and temperature. In the last panel, the red horizontal line indicates the threshold Rt = 1. Orange horizontal bars highlight weeks with sustained transmission (Rt > 1). At least two weeks with Rt > 1 are required to move the alert level from yellow to orange.
Sustained transmission
Detection of atypical incidence
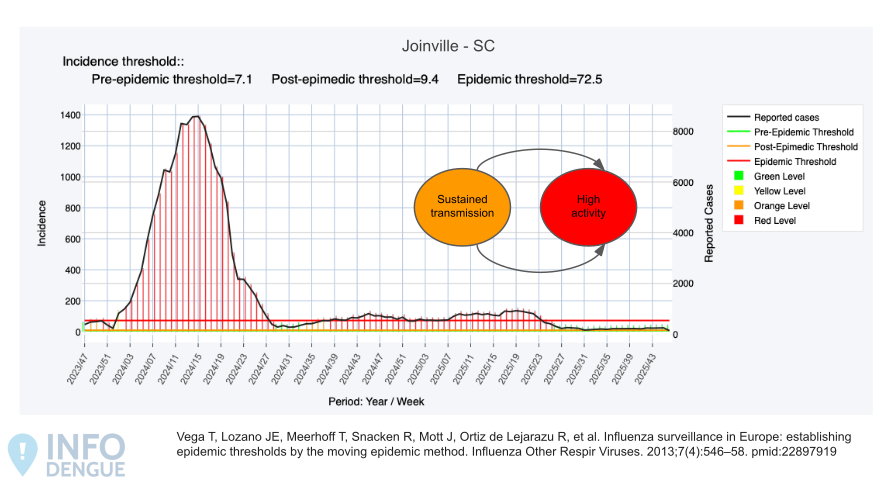
To estimate epidemic thresholds for dengue, we adapted the Moving Epidemics Method (MEM), Vega et al. (2012), which allows estimation of several quantities of interest from local historical data—such as pre-epidemic thresholds, typical activity levels, and expected values for each week. Because these thresholds are derived from historical data, locations with different case volumes have different thresholds. The methodology also provides estimates of the expected number of cases per week, together with confidence intervals that allow definition of weekly activity zones. These regions are defined similarly to activity levels but are computed from the typical distribution of cases for each week. This construction allows visual identification of seasonal patterns, since it shows the typical temporal evolution based on the median expected cases for each week and lower/upper confidence intervals (we use 10% and 90%, respectively), defining activity corridors akin to a control chart.
The figure below appears in municipal reports available under the “Reports” tab. It shows the curve of notified cases (black), vertical bars indicating alert levels, and horizontal bars representing the epidemic thresholds calculated by MEM. At the top, the MEM-estimated values for each period are also shown: pre-epidemic, epidemic, and post-epidemic. Incidence above 90% of the MEM threshold is required to change the alert level from orange to red (high incidence).
High incidence
Alert levels for arbovirus transmission
Municipal alert. This alert is updated weekly and comprises the following levels:
- Green – Climatic conditions are not favourable for transmission (temperature or humidity), and viral activity is low.
- Yellow – Climatic conditions are favourable for transmission (temperature or humidity), and viral activity is present (at least one case).
- Orange – Rising incidence (at least two consecutive weeks with Rt > 1) but still within historical levels.
- Red – High incidence relative to historical patterns (above 90% of the MEM threshold).
The figure below shows the variation in alert levels at different periods of the epidemic curve for the city of Foz do Iguaçu.
Classification of the arbovirus transmission situation
The transmission-situation analyses are updated weekly and made available in the reports section of the site, as well as in municipal and state dashboards available on the platform. In addition, the data can be accessed in the project's API. For more information on the available materials, please access our online course.
Epi-Scanner
In addition to analysing the arbovirus transmission situation, Infodengue develops and provides other decision-support resources. An additional resource of the project is the Epi-Scanner, a methodology designed to estimate epidemiological parameters for each epidemic and municipality in the country. Estimated parameters include the peak week, the reproduction number, and the total number of cases in the season.
More details can be found on the dashboard of the product. The paper describing the methodology can be accessed here.
Infodengue–Mosqlimate challenge for forecasting dengue epidemics
In addition to weekly reports, since 2024 Infodengue, in partnership with the Mosqlimate, has organised a long-term dengue forecasting challenge at the state level, aiming to combine efforts from different modelling strategies. The results of this competition are aggregated into a report sent to the Ministry of Health to support preparation for the next season.
More information about the competition can be found here. The reports generated by this initiative are available in the Technical reports section.
Research projects
2022-2023
ARBOFRONTEIRA: Forecasting epidemics of mosquito-borne diseases in the southern arc of the country
The objective of this proposal is to generate surveillance indicators for arboviruses specific to the country’s southern border and to provide guidelines for their use in strengthening municipal surveillance. This requires understanding how arboviruses have expanded across the three countries and identifying future expansion scenarios. Using statistical and mathematical models, we will investigate possible dissemination scenarios and the importance of bi- and trinational protocols for more precise control actions. Practically, nowcasting and forecasting models will be applied in two areas: the tri-border region of Foz do Iguaçu, Iguazú, and Ciudad del Este; and the border formed by Barracão (PR), Dionísio Cerqueira (SC), and Bernardo de Irigoyen (ARG). The models will be incorporated into Infodengue, and region-specific reports will be provided.
Funding: INOVA Fiocruz
2020-2021
Forecasting epidemics of mosquito-borne diseases
This project aims to provide medium-term projections for the incidence of new cases of mosquito-borne diseases in Brazil. It adapts to the Brazilian context an approach implemented in Vietnam, proposing Bayesian spatio-temporal hierarchical models to forecast dengue incidence with support from auxiliary variables such as climatic factors (Colon-Gonzalez, Bastos, et al., 2021). Here we extend dengue predictive modelling from Vietnam to mosquito-borne diseases, exploring arboviruses in Brazil and malaria in the Amazon region—both of major public-health relevance. Models will be built and validated using open data, and medium-term projections (six to twelve months ahead) will be produced for health microregions. The project prioritises open data and open-source development so that epidemiological surveillance teams can replicate and adapt as needed. In parallel, a disease-specific dashboard will be developed so forecasts are accessible to decision-makers and the general public.
Funding: INOVA Fiocruz
2019-2023
EVIGILANCIA: integrated and continuous monitoring of arboviroses
This project sought to consolidate the arbovirus alert system based on hybrid data generated through integrated analysis of regional climatic and epidemiological data—Infodengue.
Funding: INOVA Fiocruz
How to cite Infodengue
A nowcasting system for the surveillance of arboviruses in Brazil, Revue d'Épidémiologie et de Santé Publique, Vol 66, Suppl 5, 2018, Page S386, https://doi.org/10.1016/j.respe.2018.05.408
@article{CODECO2018S386,
title = "Infodengue: A nowcasting system for the surveillance of arboviruses in Brazil",
journal = "Revue d'Épidémiologie et de Santé Publique",
volume = "66",
pages = "S386",
year = "2018",
note = "European Congress of Epidemiology “Crises, epidemiological transitions and the role of epidemiologists”",
issn = "0398-7620",
doi = "https://doi.org/10.1016/j.respe.2018.05.408",
url = "http://www.sciencedirect.com/science/article/pii/S0398762018311088",
author = "C. Codeco and F. Coelho and O. Cruz and S. Oliveira and T. Castro and L. Bastos"}
Scientific publications associated with Infodengue
2022
- Codeco C.T., Oliveira S.S., Ferreira D.A.C., Riback T.I.S., Bastos L.S., Lana R.M., Almeida I.F., Godinho V.B., Cruz O.G., and Coelho F.C. Fast expansion of dengue in brazil. The Lancet Regional Health - Americas, link
- Miller S, Preis T, Mizzi G, Bastos LS, Gomes, MFC, Coelho FC, Codeço CT, Moat SH. Faster indicators of chikungunya incidence using Google searches Plos Computational Biology, link
2021
- Alves L.D., Lana R.M., and Coelho F.C. A framework for weather-driven dengue virus transmission dynamics in different Brazilian regions. International Journal of Environmental Research and Public Health, link
- Colon-Gonzalez, Bastos, et al. (2021) Probabilistic seasonal dengue forecasting in Vietnam: A modelling study using superensembles PLOS Medicine, link
2020
- Elisa Mussumeci, Flávio Codeço Coelho. Large-scale multivariate forecasting models for Dengue - LSTM versus random forest regression, Spatial and Spatio-temporal Epidemiology, link
- Lowe R., Lee S., Lana R.M., Codeço C.T., Castro M.C., and Pascual M. Emerging arboviruses in the urbanized amazon rainforest. BMJ, link
2019
- Bastos LS, Economou T, Gomes MG, Villela DAM, Coelho OG, Stoner O, Bailey T, Codeço CT. A modelling approach for correcting reporting delays in disease surveillance data. Statistics in Medicine, link
- Coelho FC, Codeço CT. Precision epidemiology of arboviral diseases. Journal of Public Health and Emergency, link
2018
- Santos, B.C., Coelho F.C., Armstrong M, Sarraceni V, Lemos C. Zika: an ongoing threat to women and infant. Cadernos de Saude Publica, link
- Codeço, C.T., Villela A.M.D. , Coelho F.C. Estimating the effective reproduction number of dengue considering temperature-dependent generation intervals. Epidemics, link
- Codeço, C.T., Coelho F.C., Cruz, O.G., Oliveira, S. Castro, T. Bastos, L.S. Infodengue: A nowcasting system for the surveillance of arboviruses in Brazil. Revue d'Épidémiologie et de Santé Publique, link
- Lana R.M., Morais M.M., Lima T.F.M., Carneiro T.G.S., Stolerman L.M., Santos J.P.C., Cortês J.J.C., Eiras A.E., and Codeço C.T. Assessment of a trap based aedes aegypti surveillance program using mathematical modeling. PLOS ONE, link
2017
- Lana R.M., Gomes M.F.C., Lima T.F.M., Honório N.A., and Codeço C.T. The introduction of dengue follows transportation infrastructure changes in the state of acre, brazil: A network-based analysis. PLOS Neglected Tropical Diseases, link
2016
- Coelho et al. Epidemiological data accessibility in Brazil, The Lancet ID, link
Events
How to collaborate
• If you are a student or researcher and would like to contribute analyses and models, write to us.
• If you would like to contribute with sponsorships, write to us.
• If you want to learn how to use Infodengue, have suggestions or criticisms, or noticed any error on the site, write to us.
Beating arboviruses is everyone’s work—every contribution is welcome!
Related videos
Understand the model most used to represent the COVID-19 pandemic
PySUS course — Lesson 1
More videos from the series on the channel : The mathematics of epidemics